What Factors Should You Consider When Calculating Total Cost of Ownership (TCO) for Industrial Valves?
Table of Contents
When a $50 gate valve fails and shuts down a production line, the math no longer adds up. That cheap valve might have saved a few dollars upfront, but now it triggers an emergency response costing thousands. Yet in most procurement meetings, the discussion still focus on: “What’s the price?”
That’s the wrong question.
Total cost of ownership (TCO) for industrial valves isn’t just a theory — it’s a practical tool. It separates smart buys from long-term budget drains.
This guide walks through the factors that actually drive valve TCO, drawing on industry data, real-world cases, and engineering principles.
Why Does Initial Purchase Price Only Tell a Fraction of the Valve Cost Story?
The 10–15% Rule: What Industry Data Tells About TCO Distribution
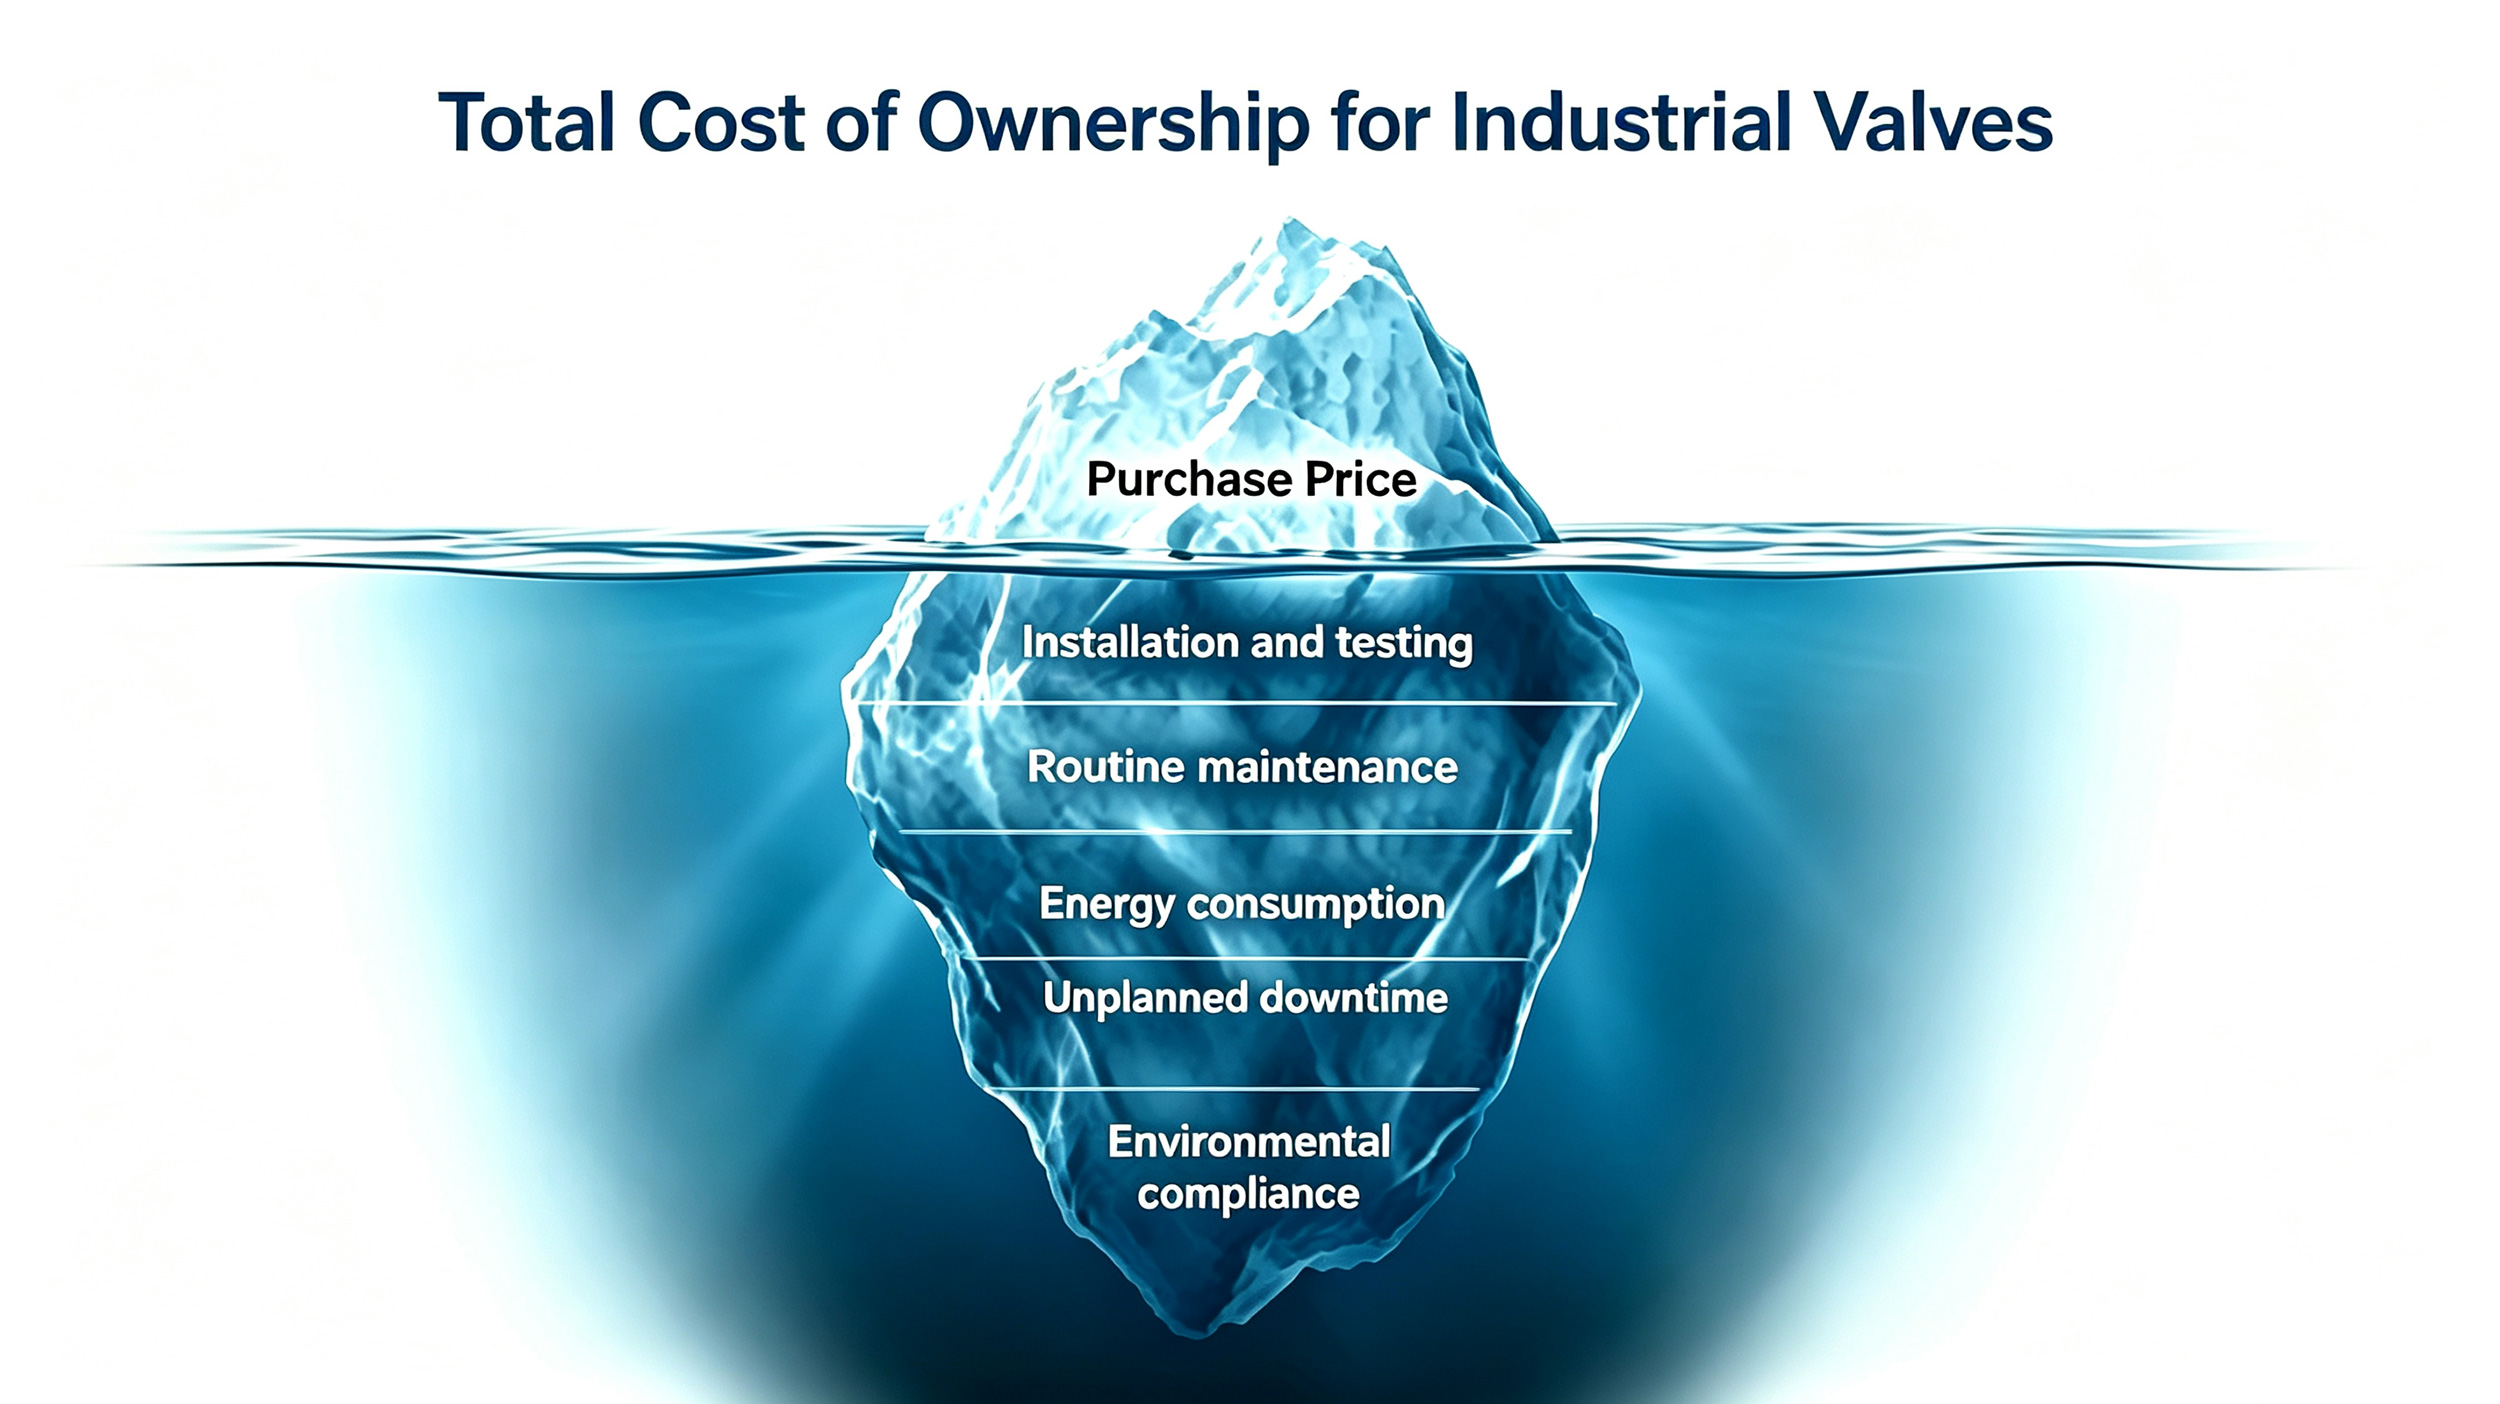
The U.S. Department of Energy defines Life-Cycle Cost (LCC) as the total consumer cost over a product’s life, including installed cost and all operating costs such as energy, maintenance, and repairs. For industrial valves, the data is clear. The purchase price is only 10–15% of the total lifetime cost.
Where does the rest go?
This shows a major problem with current procurement habits. Buying a valve for 30% more might reduce overall costs by 50%. But many purchasing decisions still chase the lowest quote.
Why “Cheap” Valves Often Become the Most Expensive Decision
Why are some valves so cheap? The manufacturer cut costs somewhere.
A budget valve may use lower-grade alloys, less rigorous heat treatment, or simplified internal geometry that compromises sealing performance. In clean, low-pressure, non-critical applications, these shortcuts might never matter. But in real industrial conditions such as temperature cycling, pressure surges, particulate-laden media, the weaknesses will quickly become apparent.
Industry experience shows a big difference in lifespan. A budget valve in a tough service might last 2–5 years. A well-made valve can run for 10–20 years. Over two decades, the cheap valve might need four to ten replacements. The total purchase price alone can be five times higher. That does not include the cost of downtime or extra maintenance.
How Does Unplanned Downtime Become the Single Largest TCO Driver?
The Real Cost of Production Stoppage: From Lost Revenue to Idle Labor
Unplanned downtime is the single largest cost component in valve TCO — and also the most overlooked.
Industry data provides a stark picture:
- Manufacturing operations: $25,000 to $125,000 per hour
- Chemical processing: $50,000 to $150,000 per hour
- Large automotive plants: over $2.3 million per hour
Think about a $5,000 valve. It is expensive. But a single hour of downtime it causes can cost ten times that amount.
When we say “downtime cost,” we aren’t just talking about lost production. We’re talking about:
Emergency Response Costs: Expedited Freight, Overtime, and Crisis Mode
The immediate cost of a failed valve is bad enough. The emergency response that follows makes it worse.
When a valve breaks, there is no time for competitive bidding. You need a replacement now.
Here is what happens to your budgets:
One facility experienced a solenoid valve failure that cost over $50,000 in downtime and emergency response — from a component that originally cost less than $500. That’s a 100:1 ratio that no procurement spreadsheet ever captures.
What Maintenance and Repair Costs Are Hidden in Valve Lifecycle Planning?
Routine Maintenance vs. Reactive Firefighting: The Cost Divergence
There are two ways to manage valve maintenance.
Industry experience suggests that budget-grade valves generate 3–5 times more maintenance demand than quality alternatives in comparable service. The difference shows up in:
- More frequent packing adjustments
- Premature seat wear
- Actuator recalibration
- Emergency leak repairs
Valve Design and Its Impact on Repairability and Spare Parts Standardization
Valve design affects maintenance costs. Some valves are easy to work on. Others are not.
Consider two-piece and three-piece ball valves.
| Design Feature | Two-Piece Ball Valve | Three-Piece Ball Valve |
|---|---|---|
| In-line maintenance | Not possible — valve must be removed from pipeline | Possible — center section swings out for seat replacement |
| Maintenance downtime | Entire pipeline section must be isolated | Only valve body needs isolation |
| Repair cost | Higher (needs a line break) | Lower (inline service) |
| Spare parts complexity | Moderate | Standardized repair kits available |
How Do Valve Type and Design Affect Energy Consumption Over Time?
Pressure Drop and Pumping Energy: The Continuous Operating Cost
Every valve in a pipeline creates flow resistance — and that resistance requires energy to overcome. Over years of continuous operation, even small differences in pressure drop translate into significant energy costs.
For a DN150 steam pipeline running 1,000 meters, replacing a ball valve with a gate valve can reduce pipeline friction loss by an additional 8–12% — translating to tens of thousands of kilowatt-hours saved annually.
The difference comes down to flow path design:
- Gate valves (fully open): flow resistance coefficient of 10–20
- Ball valves (fully open): flow resistance coefficient of 35–50
At a typical 24/7 industrial facility, an extra 5% pressure drop can mean thousands of dollars in annual pumping or compression costs. Over a decade, that’s real money.
Fugitive Emissions and Energy Waste: The Environmental Cost Dimension
Fugitive emissions — leakage from valve seals and packing — represent both an environmental compliance cost and a direct product loss cost. Every molecule that escapes through a leaking valve is product that didn’t reach the customer.
The numbers can be shocking. One plant had 30,000 valves and 105,000 connections. They switched to low-emission gaskets and packing. Their emissions dropped from 639 tons per year to just 1 ton per year. They saved $900,000 annually from recovered product.
Regulations are also getting stricter. The EPA sets charges for methane emissions. States like Colorado impose fines for non-compliance. Low-emission packing is a small extra cost. It pays off through compliance, product recovery, and reduced maintenance.
What Role Do Industry Standards and Compliance Play in TCO?
API Standards and Fire-Safe Certification: When Compliance Becomes Cost Protection
The reason for the existence of API standards is that they standardize engineering practices to prevent catastrophic failures.
For valves in hydrocarbon service, API 607 (fire test for quarter-turn valves), API 608 (metal ball valves), and API 6D (pipeline valves) are foundational.
Fire-safe certification requires valves to maintain sealing integrity during and after a fire. This feature, although having a limited cost, can prevent significant losses to the product and environmental damage.
A common mistake is to specify a fire-safe ball valve “with no graphite”. Without graphite packing, the valve cannot pass API 607 certification. This is why accurate technical data matters: a fire-safe ball valve requires graphite-based stem sealing and seat materials capable of surviving high temperatures.
Environmental Regulations and the Cost of Non-Compliance
Beyond performance standards, environmental regulations increasingly mandate low-emission designs.
ISO 15848 establishes requirements for fugitive emissions testing and classification. Valves meeting this standard have verified low leakage rates — and are more likely to pass environmental audits.
Non-compliance costs take multiple forms:
Low-emission technology is a smart investment. For example, one company’s zero-emissions electric dump valves use only 1.2 watts of power. This is a 98.75% reduction compared to standard kits. They are more efficient and fully compliant.
How Can Procurement Teams Build a TCO-Optimized Valve Sourcing Strategy?
A Practical TCO Calculation Framework for Valve Selection
You need a clear framework to calculate TCO:
TCO = CAPEX + OPEX + Risk Cost
Let’s explain these parts:
- CAPEX→ Purchase price and installation cost
- OPEX→ Maintenance, spare parts, energy consumption, and labor
- Risk Cost→ Downtime impact, environmental compliance, and safety incidents
For a 10-year comparison:
| Cost Component | Low-Cost Valve | High-Quality Valve |
|---|---|---|
| Purchase price | $5,000 | $7,500 |
| Replacement cycles (10 yrs) | 3x ($15,000) | 1x ($7,500) |
| Maintenance cost | $10,000 | $3,000 |
| Energy/emissions loss | $15,000 | $5,000 |
| Downtime risk | High (5 incidents) | Low (1 incident) |
| 10-Year Total | ~$70,000 | ~$20,000 |
From CAPEX Defense to Lifecycle Value
The shift from “lowest bid wins” to “lowest TCO wins” requires a procurement philosophy change. It means:
- Ask for TCO data. Suppliers should provide lifecycle cost estimates for your application.
- Consider maintenance logistics. Can the valve be serviced in-line? Are parts available? How long will repairs take?
- Know your downtime cost. If your plant loses $100,000 per hour, a valve that fails once less per year is worth a significant premium.
- Verify compliance. Ask for proof of API 607, API 6D, and ISO 15848.
At BallValve Technology, we provide OEM, ODM, and private-label valve manufacturing for industrial applications. Whether you need ball valves, gate valves, butterfly valves, or Y-strainers, our engineering team can help you evaluate TCO for your specific operating conditions.
Conclusion
Total Cost of Ownership for industrial valves is not a theoretical exercise. It’s a practical reality that shapes plant profitability, operational reliability, and regulatory compliance.
The key takeaways:
If you are planning a new project, or just want to optimize your inventory, contact us at [email protected] to discuss your specific requirements. We can help you with a TCO analysis and find the right valve for your application.
FAQ
References
-
Valve Magazine. “What Does It Really Cost? Calculating the costs and benefits of low emissions technologies.” valvemagazine.com, November 1, 2024. https://valvemagazine.com/articles/what-does-it-really-cost/
-
U.S. Department of Energy. “Life-Cycle Cost Analysis Inputs.” EERE-2019-BT-STD-0034-0020. https://downloads.regulations.gov/EERE-2019-BT-STD-0034-0020/content.pdf
-
API (American Petroleum Institute). “API SPEC 6D: Specification for Valves.” 2025 Edition. https://www.dinmedia.de/en/technical-rule/api-spec-6d/390494750
-
Research and Markets. “Global Metal Valves Market 2023-2027.” October 2023. https://www.researchandmarkets.com/reports/5899942/global-metal-valves-market
-
Parker-Richard, Laura. “Spilling the Oil on Valve Quoting.” Pumps & Systems, April 25, 2021. https://www.pumpsandsystems.com/spilling-oil-valve-quoting
-
McIlvaine Company. “Valve Forecasts for Every Market Niche.” July 2021. http://home.mcilvainecompany.com/index.php/…/1670-nr2656

With nearly 20 years of full-cycle valve industry experience – from metallurgy to intelligent control – Steven drives industry standards. He excels in high-level design for water and petrochemical projects, builds engineering team capabilities, and delivers reliable, efficient, cost-effective valve solutions to all industrial end-users.